
Demodulated Signal-to-Noise Quality Measurement Report Mapping in Telecom

In today's wireless networks—think LTE, 5G NR, and Wi-Fi—signal quality is super important for how well the system performs. One key metric we look at to evaluate link quality is the Signal-to-Noise Ratio (SNR).
While raw SNR values give us some insight into how clear the signals are compared to the noise, wireless systems need a more organized way to map, report, and interpret these values to really optimize the network.
This is where Demodulated Signal-to-Noise Quality Measurement Report Mapping comes into the picture. It’s all about turning those continuous SNR measurements into specific reported values that network management systems can process more easily.
The diagram attached shows how this mapping works, detailing how various SNR ranges correspond to particular report codes. Let’s dive into that a bit more.
What is Signal-to-Noise Ratio (SNR)?
SNR is basically the ratio of the power of the signal we receive to the power of the background noise.
High SNR means better signal quality and fewer errors.
Low SNR indicates a weaker signal and more bit errors.
Mathematically, it’s expressed as:
SNR(dB)=10log10(Psignal Pnoise)SNR (dB) = 10 \log_{10}\left(\frac{P_{signal}}{P_{noise}}\right)SNR(dB)=10log10(Pnoise Psignal)
Here’s what the symbols mean:
PsignalP_{signal}Psignal = power of the received signal
PnoiseP_{noise}Pnoise = power of the noise in the same bandwidth
In the telecom world, SNR is given in decibels (dB) and it plays a critical role in things like:
Adaptive Modulation and Coding (AMC)
Handover decisions
Link adaptation algorithms
Quality of Service (QoS) monitoring
Why Mapping of SNR is Necessary
SNR is a continuous value, but telecom networks usually work with discrete levels for better efficiency and standardization.
Here’s why mapping matters:
Compact Reporting: Instead of sending raw SNR values, the UE (User Equipment) can just report an index (like SNR ext{200} or SNR ext{150}).
Interoperability: It makes sure that different vendors and network equipment interpret things consistently.
Resource Efficiency: This method cuts down on signaling overhead by compressing detailed SNR data into specific ranges.
Better Decision Making: It helps with making timely decisions about scheduling, resource distribution, and managing mobility.
SNR Measurement Report Mapping Unpacked
The mapping process takes each SNR range and assigns it a reported value.
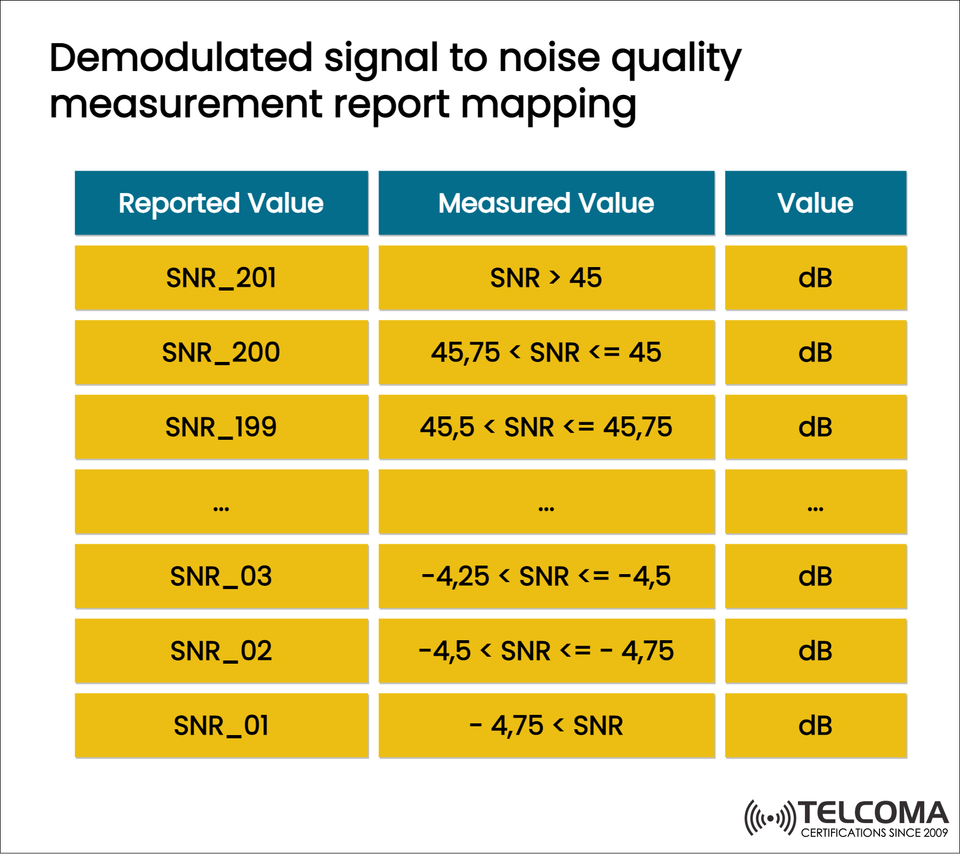
From the diagram, we see:
SNR ext{201} → SNR > 45 dB
SNR ext{200} → 45.75 < SNR ≤ 45 dB
SNR ext{199} → 45.5 < SNR ≤ 45.75 dB
SNR ext{03} → -4.25 < SNR ≤ -4.5 dB
SNR ext{02} → -4.5 < SNR ≤ -4.75 dB
SNR ext{01} → SNR < -4.75 dB
This way of doing things allows for accurate but streamlined signal quality reporting.
Understanding the Reported Values
- Upper Range (High SNR Values)
SNR ext{201} and SNR ext{200} show very high signal quality (over 45 dB).
You usually see this in short-range, low-interference settings.
This allows for higher-order modulation (think 256-QAM or even higher).
- Middle Range (Moderate SNR Values)
Most real wireless connections fall into this category.
It determines whether to go with more reliable modulation schemes like QPSK or faster options like 64-QAM.
This dynamic setup helps make efficient use of the spectrum.
- Lower Range (Negative SNR Values)
These represent very poor signal conditions where noise is the main issue.
For example, SNR ext{01} corresponds to < -4.75 dB.
Communication here is often unstable and likely to have errors.
Practical Uses of SNR Report Mapping
- Adaptive Modulation and Coding (AMC)
Networks will tweak modulation schemes based on the SNR values reported.
High SNR means more throughput (like using 256-QAM).
Low SNR results in more robust but slower modulation (like QPSK).
- Handover and Mobility Decisions
If SNR falls below certain thresholds, UEs might get switched to a neighboring cell with better signal quality.
- Scheduling and Resource Allocation
eNodeB or gNodeB schedulers give priority to users with higher SNR for data-heavy tasks.
This approach ensures fairness and optimizes spectrum use.
- Network Performance Monitoring
Operators keep an eye on reported SNR values from UEs.
This helps in spotting coverage gaps, interference areas, and capacity issues.
- QoS and User Experience
Apps like VoIP and video streaming depend on stable SNR levels.
The mapping allows for real-time adjustments to help maintain quality.
Example Table: SNR Report Mapping
Reported Value Measured SNR Range Interpretation SNR ext{201}SNR > 45Excellent quality SNR ext{200}45.75 < SNR ≤ 45Very high quality SNR ext{199}45.5 < SNR ≤ 45.75High quality.........SNR ext{03}-4.25 < SNR ≤ -4.5Very poor quality SNR ext{02}-4.5 < SNR ≤ -4.75Critical degradation SNR ext{01}SNR < -4.75Unusable connection
Challenges in SNR Reporting
Even though SNR mapping is handy, it does come with some downsides:
Quantization Error: Discretizing can introduce slight inaccuracies.
Dynamic Environments: Channels that change rapidly (like with mobility or fading) might need frequent report updates.
Interference Effects: SNR doesn’t always capture interference accurately; SINR (Signal-to-Interference-plus-Noise Ratio) might give a better picture.
Vendor Variations: Different equipment makers might have slightly different thresholds for their mapping.
Future Directions: Beyond SNR
As networks gear up for 6G, depending solely on SNR might fall short. Future systems could involve:
Using SINR and CQI (Channel Quality Indicator) for more accurate reporting.
Implementing AI-driven quality prediction to foresee channel issues before they hit.
Engaging in cross-layer optimization, where app QoS needs directly shape measurement reporting.
Key Takeaways
Demodulated SNR mapping takes raw continuous values and turns them into discrete metrics that can be reported.
This makes reporting easier, cuts down on overhead, and standardizes the way things are interpreted across telecom systems.
Higher reported values (SNR ext{200}+ ) signify excellent link quality, while lower ones (SNR ext{01-03}) point to degraded conditions.
Mapping is crucial for applications like AMC, handovers, scheduling, and QoS monitoring.
While it's effective, there are limitations, and future networks may leverage AI-enhanced, interference-aware metrics.
Comparing SNR, SINR, and CQI Reporting
SNR (Signal-to-Noise Ratio) is an essential metric, but in today's telecom networks like LTE and 5G NR, we also use other important indicators such as SINR (Signal-to-Interference-plus-Noise Ratio) and CQI (Channel Quality Indicator) to make decisions. Let's break down how these different metrics stack up:
Key Insights
SNR is essential: It serves as the basic measurement but it’s not enough when there’s a lot of interference from multiple cells.
SINR adds depth: Besides accounting for background noise, it also considers interference from nearby cells, which makes it a better fit for 5G and HetNet situations.
CQI connects the dots: It translates raw SNR/SINR data into usable indices that help base stations figure out the optimal modulation and coding scheme (MCS).
Take this example:
When a UE shows SNR _201 (> 45 dB), the scheduler can go ahead with 256-QAM and a high coding rate.
If the UE reads SNR _05 (~ -3 dB), then it'll fall back on more robust options like QPSK with lower coding rates.
SNR Mapping and CQI Reporting
In LTE and 5G NR:
The UE constantly checks its SNR and SINR on downlink channels.
These readings are mapped to CQI indices.
The UE sends CQI back to the base station.
The scheduler adjusts based on CQI: * High CQI → Higher modulation (64-QAM, 256-QAM) * Low CQI → Lower modulation (QPSK)
So, SNR mapping acts as a middle step that helps turn raw link quality into smart resource management for the network.
Conclusion
The demodulated signal-to-noise quality measurement report mapping is vital in telecom. By converting raw SNR measurements to standardized values, operators can ensure efficient resource management, reliable handovers, and a better user experience.
As 5G continues to grow and 6G approaches, tools for measuring and reporting will keep evolving—bringing in SINR, interference metrics, and AI insights. Yet, the core idea of mapping complex raw values into standardized reports will stay a fundamental part of wireless communication.