
Measurement Report Mapping: RSSI Explained for LTE & 5G

In wireless communication, measuring signal strength is absolutely essential for keeping connections reliable. As users move between different cells or as networks change, base stations and user equipment (UE) need accurate updates on signal levels. That’s where Measurement Report Mapping comes in handy.
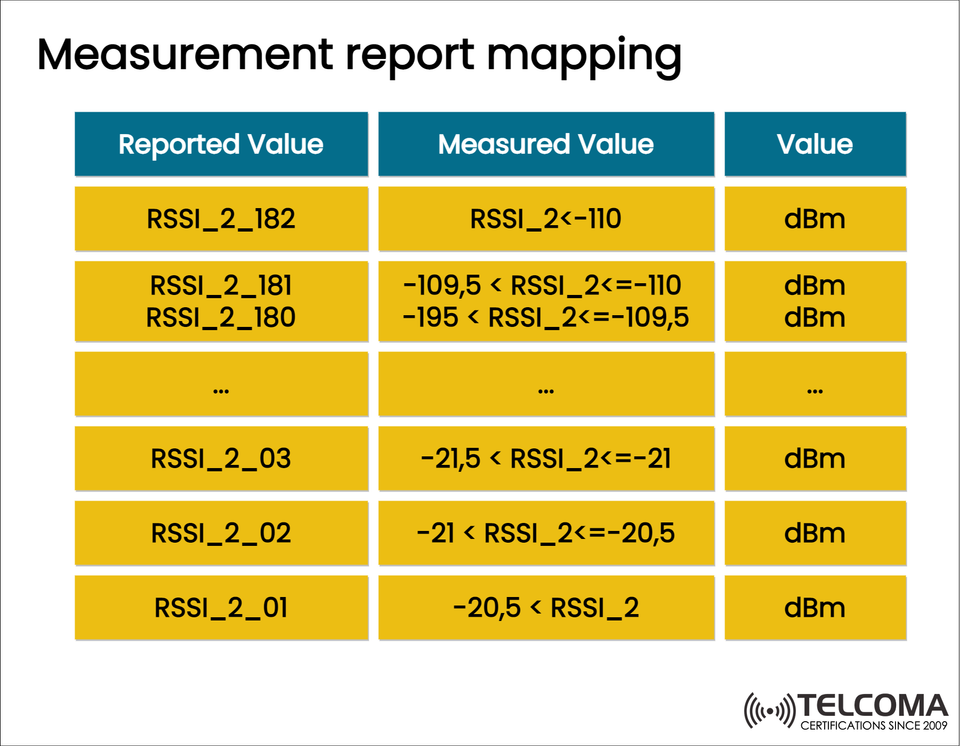
One of the key parameters that UEs report is the RSSI (Received Signal Strength Indicator). The image above shows how values like RSSI_2_182, RSSI_2_03, and others correspond to actual signal measurements in dBm. Getting a grip on this mapping helps network engineers improve performance, make handovers smoother, and enhance Quality of Service (QoS).
What is RSSI?
RSSI stands for Received Signal Strength Indicator, and it measures the total power received at the UE antenna. This includes:
Desired signal power
Co-channel interference
Adjacent channel interference
Thermal noise
RSSI is measured in dBm, and it’s always negative in wireless systems because the received signals are way weaker than those that were transmitted.
For reference:
-50 dBm means a very strong signal
-90 dBm indicates a weak but usable signal
-110 dBm or lower shows a very poor signal
Why RSSI Measurement Report Mapping is Needed
If we reported raw RSSI values from every UE, it could really bog down the system with high signaling overhead in LTE and 5G networks. To keep things simpler, the system uses discrete mapping tables.
Here’s why that mapping is so important:
Standardization – It ensures everyone’s on the same page across different vendors and networks.
Efficiency – Instead of sending every single dBm value, the UE just sends an index (like RSSI_2_100).
Scalability – This setup works well even when dealing with thousands of UEs simultaneously.
Interoperability – It makes those handovers between different vendor equipment much smoother.
Breaking Down the RSSI Measurement Report Mapping
The uploaded image reveals how reported values map to actual measured dBm ranges:
Reported Value Measured Value RangeUnitRSSI_2_182RSSI_2 < -110 dBmdBmRSSI_2_181-109.5 < RSSI_2 ≤ -110 dBmdBmRSSI_2_180-109 < RSSI_2 ≤ -109.5 dBm dBm.........RSSI_2_03-21.5 < RSSI_2 ≤ -21 dBmdBmRSSI_2_02-21 < RSSI_2 ≤ -20.5 dBmdBmRSSI_2_01-20.5 < RSSI_2dBm
Key Insights:
Lower indices (like RSSI_2_01 and RSSI_2_02) indicate higher, better signal levels.
Higher indices (like RSSI_2_180 and RSSI_2_182) point to weaker signals.
The mapping uses 0.5 dB step sizes, providing a detailed look without overwhelming reporting.
RSSI vs. RSRP vs. RSRQ
While RSSI is quite important, LTE and 5G networks also make use of additional metrics:
Metric Definition Use Case RSSI Total received wideband power including interference & noise Initial signal detection RSRP Average power of reference signals (pilot tones)Coverage measurement RSRQ Ratio of RSRP to RSSI Quality measurement and handover decisions
So, while RSSI gives the basic power level, RSRP and RSRQ fine-tune the quality assessment for things like mobility and scheduling.
How Networks Use RSSI Measurement Mapping
RSSI mapping plays a vital role in many network functions:
Cell Selection & Reselection * UEs rely on mapped RSSI values to spot available cells when they’re not actively connected.
Handover Decisions * When moving, mapped RSSI reports are checked against thresholds to enable smooth handovers.
Power Control * This helps adjust UE transmit power to cut down on interference and extend battery life.
Coverage Optimization * Tools used in network planning utilize aggregated RSSI reports for creating coverage heatmaps.
Interference Management * Pinpointing weak RSSI zones assists in deploying small cells or tweaking antenna angles.
Practical Example
Let’s say a UE reports RSSI_2_181. Based on the mapping table:
This translates to -109.5 < RSSI ≤ -110 dBm.
The network sees this as a very weak signal.
Possible actions could be: * Initiate a handover to a nearby cell with a stronger signal. * If no better options are available, increase transmit power or modify scheduling.
On the flip side, if the UE reports RSSI_2_05 (around -22 dBm), that’s an extremely strong signal, allowing the network to use high-order modulation (256-QAM) for improved throughput.
RSSI Measurement in 5G NR
In 5G NR, RSSI reporting is still crucial, but it’s been enhanced:
Beam-level RSSI reporting is used for directional transmissions.
Multi-carrier aggregation RSSI mapping keeps track of multiple frequency bands.
Interference-aware reporting is now a thing in ultra-dense networks.
Looking ahead, 6G systems might combine AI-driven predictive modeling with RSSI mapping to anticipate user movement and dynamically optimize resources.
Advantages and Limitations of RSSI Mapping
✅ Advantages:
Cuts down on signaling overhead
Provides standardization across devices
Maintains backward compatibility with LTE/5G
Aids in making accurate handover decisions
❌ Limitations:
RSSI by itself can’t distinguish good signals from interference
RSRP and RSRQ are needed for a complete quality assessment
Very high or low mapping ranges might still create reporting confusion
Key Measurement Parameters
Here’s a quick comparison table that breaks down these measurements:
Parameter Full Form What It Measures Typical Range Primary Use RSSI Received Signal Strength Indicator Total received power (signal + interference + noise)-110 to -20 dBm Initial detection, baseline power RSRP Reference Signal Received Power Average power of reference (pilot) signals-140 to -44 dBm Coverage & handover decisions RSRQ Reference Signal Received Quality RSRP ÷ RSSI × N (N = RBs)-19.5 to -3 dB Signal quality, interference detection SINR Signal-to-Interference-plus-Noise Ratio Ratio of useful signal to interference and noise-10 to +30 dB Scheduling, link adaptation CQI Channel Quality Indicator Quantized report of channel quality mapped to MCS0 to 15 (LTE)Modulation & coding scheme selection
Conclusion
Measurement report mapping for RSSI is a key process in modern telecom networks. By translating raw dBm values into standardized reported indices, LTE and 5G systems achieve efficiency, scalability, and interoperability.
For engineers, it’s a way to fine-tune networks and manage mobility precisely.
For telecom enthusiasts, it showcases the complexity behind everyday wireless communications.
For the industry, it’s the groundwork for future advancements in 5G Advanced and 6G.
In the end, while RSSI mapping alone doesn’t capture the whole picture of signal quality, it serves as the baseline metric from which more advanced indicators like RSRP, RSRQ, SINR, and CQI are derived, ensuring dependable and adaptable wireless communication.