
Three-Layer EQN Mapping Model: Network Baseline, Quality, and User Experience in Telecom

These days, telecom networks aren’t just about coverage or how much data they can handle. With the arrival of 5G and cloud-based services — think VR, AR, and high-definition video streaming — the focus has shifted to what users actually experience.
But figuring out how to connect network performance measures (like bandwidth or latency) with user experience (like video quality or buffering issues) isn't simple. That’s where the three-layer EQN mapping model comes into play.
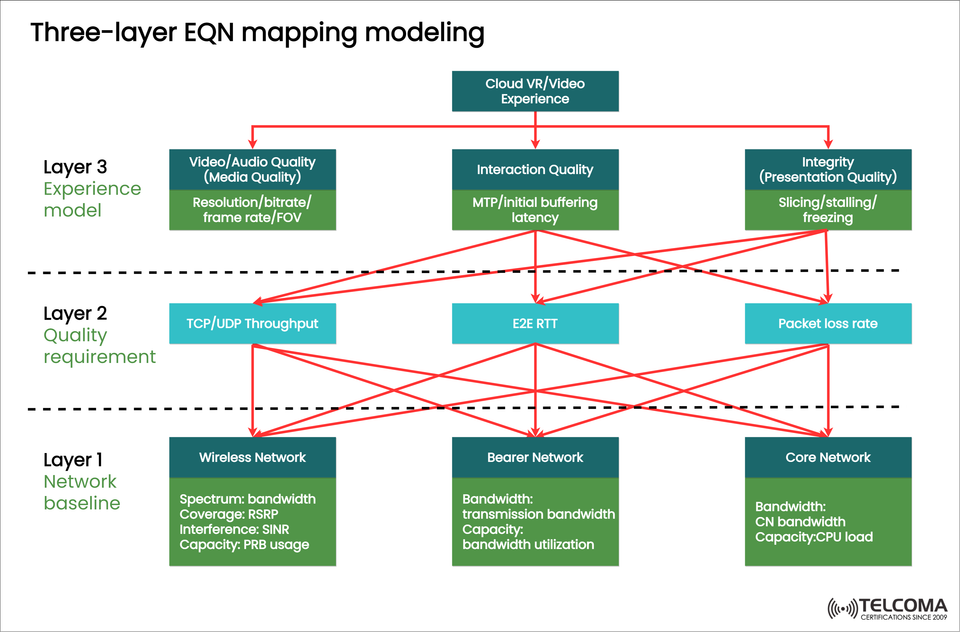
The diagram we provided shows how telecom operators can effectively map network baselines to quality needs and then to user experience. In this article, we’ll break each layer down and explain how they link up.
What is EQN Mapping?
EQN (Experience, Quality, Network) mapping is a framework that links:
Network performance indicators (these are objective and measurable)
Quality metrics (which are specific to the service and mid-level KPIs)
User experience outcomes (the subjective take on quality)
This three-layer model helps folks in telecom understand how tuning their networks affects real-world applications like cloud gaming, VR/AR, and video conferencing.
The Three-Layer EQN Mapping Model
The model has three distinct layers:
Layer 1: Network Baseline
Layer 2: Quality Requirements
Layer 3: Experience Model
Let's dig into each layer.
Layer 1: Network Baseline
This layer lays the groundwork for telecom infrastructure, dealing with both physical and logical resources across:
Wireless Network: * Spectrum and bandwidth availability * Coverage (RSRP – Reference Signal Received Power) * Interference (SINR – Signal-to-Interference-plus-Noise Ratio) * Capacity (PRB – Physical Resource Block usage)
Bearer Network: * Transmission bandwidth * Capacity utilization
Core Network: * Bandwidth in the core network (CN bandwidth) * Processing capacity (CPU load)
Why it matters:
Without a solid foundation of spectrum, coverage, and backhaul/core resources, even the best applications won’t offer a smooth user experience.
Layer 2: Quality Requirements
This middle layer bridges the gap between raw network data and application demands. It turns technical resources into measurable service quality indicators.
Key metrics in this layer include:
TCP/UDP Throughput: This shows how well data gets delivered for applications.
E2E RTT (Round-Trip Time): This is crucial for latency in interactive services.
Packet Loss Rate: It affects the quality of voice/video calls and real-time apps.
Example:
For video streaming, high throughput is a must, but there can be some leeway on latency.
Cloud VR needs ultra-low RTT and minimal packet loss to keep things seamless.
Layer 3: Experience Model
At the top of the model is the user experience layer — this is how we know if the network is doing well. This layer takes quality metrics and translates them into what people actually perceive:
Video/Audio Quality (Media Quality): * Resolution, bitrate, frame rate, and field of view (FOV)
Interaction Quality: * Motion-to-Photon (MTP) latency * Initial buffering delays
Integrity (Presentation Quality): * Issues like slicing, stalling, or freezing during playback
Why it matters:
At the end of the day, users don’t care about PRB usage or SINR values. They want to know if their video call drops out or if VR is causing motion sickness from latency. This layer makes sure the network aligns with what users actually expect.
How the Layers Connect
The diagram highlights the connections between the layers with red arrows, showing how they depend on each other:
The network baseline (Layer 1) affects the quality requirements (Layer 2).
The quality requirements have a direct impact on the user experience metrics (Layer 3).
There are also feedback loops — when users face poor quality, operators check back on the network baselines to make improvements.
For instance:
If SINR is low (Layer 1), it reduces throughput (Layer 2), leading to lower video resolution (Layer 3).
A high CPU load in the core network (Layer 1) can increase RTT (Layer 2), which might cause lag in VR interactions (Layer 3).
Benefits of the EQN Mapping Model
For telecom operators and network engineers, the EQN model offers several advantages:
End-to-end visibility: It connects infrastructure performance to the customer experience.
Targeted optimization: It helps identify if issues are coming from spectrum, backhaul, or core capacity.
Service differentiation: It allows operators to create experience-based SLAs (like providing guaranteed VR latency <20 ms).
Customer satisfaction: By proactively tuning networks, it can help prevent quality-of-experience (QoE) issues.
Challenges in Implementing EQN Mapping
Although EQN mapping is powerful, it's not without its challenges:
Complex interdependencies: A change in one part of the network can affect quality and experience layers.
Dynamic environments: Factors like user mobility, interference, and traffic loads can change metrics at any time.
Measurement tools: Accurately mapping QoE needs sophisticated monitoring tools, AI/ML models, and real-time analytics.
Service diversity: Different types of services (like IoT vs. VR) need their own tailored mapping.
The model consists of three layers:
Network Baseline (Layer 1): This is the foundation of telecom infrastructure — spectrum, coverage, bandwidth, interference, and core CPU capacity. These metrics define the raw capability of the network.
Quality Requirements (Layer 2): This layer translates network conditions into service-level indicators such as throughput, end-to-end latency (RTT), and packet loss rate. These metrics determine whether applications run smoothly.
Experience Model (Layer 3): This focuses on human-perceived outcomes — things like video resolution, VR interaction smoothness, buffering delays, and presentation quality. This is where users make their judgments about quality.
How it works:
For instance, a weak SINR (Layer 1) can lower throughput (Layer 2), which then causes a drop in video resolution (Layer 3). Likewise, congestion in the core network can raise RTT, leading to degraded VR responsiveness.
Why it matters:
End-to-end visibility: It shows the connection from network resources to user experience.
Targeted optimization: It helps pinpoint whether issues stem from spectrum, backhaul, or the core.
Experience-based SLAs: It supports guarantees around latency or resolution for premium services.
Looking forward, EQN mapping will advance alongside AI-driven analytics, 6G, and network slicing, allowing operators to predict and tackle experience issues before they disrupt users.
Conclusion
The three-layer EQN mapping model provides a structured approach to bridge the gap between network infrastructure and user experience.
Layer 1 (Network Baseline): Technical foundation (spectrum, bandwidth, CPU load).
Layer 2 (Quality Requirements): Service-specific KPIs (throughput, latency, packet loss).
Layer 3 (Experience Model): Human perception of quality (video clarity, VR smoothness, app responsiveness).
By embracing EQN mapping, telecom operators can ensure their networks are not just meeting standards but also focused on creating a great user experience, paving the way for advancements in 5G, cloud VR, and more.